Satellites and Supercomputers Provide Real-Time Crop and Growing Conditions Data

Special Stories
11 Apr 2018 10:03 AM
From University of Illinois
Corn and soybean fields look similar from space – at least they used to. But now, scientists have proven a new technique for distinguishing the two crops using satellite data and the processing power of supercomputers.
“If we want to predict corn or soybean production for Illinois or the entire United States, we have to know where they are being grown,” says Kaiyu Guan, assistant professor in the Department of Natural Resources and Environmental Sciences at the University of Illinois, Blue Waters professor at the National Center for Supercomputing Applications (NCSA), and the principal investigator of the new study.
The advancement, published in Remote Sensing of Environment, is a breakthrough because, previously, national corn and soybean acreages were only made available to the public four to six months after harvest by the USDA. The lag meant policy decisions were based on stale data. But the new technique can distinguish the two major crops with 95 percent accuracy by the end of July for each field – just two or three months after planting and well before harvest.
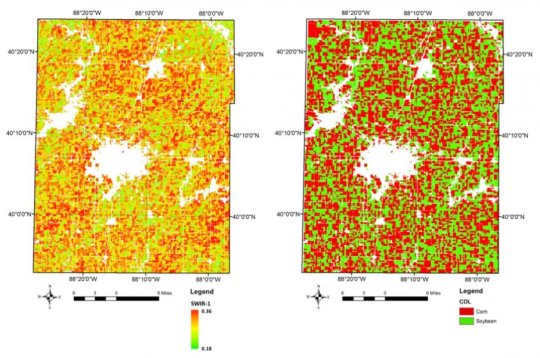 [University of Illinois scientists used short-wave infrared bands from Landsat satellites to accurately distinguish corn and soybeans during the growing season. Credit: Kaiyu Guan, University of Illinois]
The researchers argue more timely estimates of crop areas could be used for a variety of monitoring and decision-making applications, including crop insurance, land rental, supply-chain logistics, commodity markets, and more.
For Guan, however, the work’s scientific value is as important as its practical value.
A set of satellites known as Landsat have been continuously circling the Earth for 40 years, collecting images using sensors that represent different parts of the electromagnetic spectrum. Guan says most previous attempts to differentiate corn and soybean from these images were based on the visible and near-infrared part of the spectrum, but he and his team decided to try something different.
“We found a spectral band, the short-wave infrared (SWIR), that was extremely useful in identifying the difference between corn and soybean,” says Yaping Cai, Ph.D. student and first author of the work, following the guidance of Guan and another senior co-author, Shaowen Wang in the Department of Geography at U of I.
[University of Illinois scientists used short-wave infrared bands from Landsat satellites to accurately distinguish corn and soybeans during the growing season. Credit: Kaiyu Guan, University of Illinois]
The researchers argue more timely estimates of crop areas could be used for a variety of monitoring and decision-making applications, including crop insurance, land rental, supply-chain logistics, commodity markets, and more.
For Guan, however, the work’s scientific value is as important as its practical value.
A set of satellites known as Landsat have been continuously circling the Earth for 40 years, collecting images using sensors that represent different parts of the electromagnetic spectrum. Guan says most previous attempts to differentiate corn and soybean from these images were based on the visible and near-infrared part of the spectrum, but he and his team decided to try something different.
“We found a spectral band, the short-wave infrared (SWIR), that was extremely useful in identifying the difference between corn and soybean,” says Yaping Cai, Ph.D. student and first author of the work, following the guidance of Guan and another senior co-author, Shaowen Wang in the Department of Geography at U of I.
 [This gif shows the Landsat Data Continuity Mission (LDCM) spacecraft successfully separating from the booster. Credits: NASA]
It turns out corn and soybean have predictably different leaf water status by July most years. The team used SWIR data and other spectral data from three Landsat satellites over a 15-year period, and consistently picked up this leaf water status signal.
“The SWIR band is more sensitive to water content inside the leaf. That signal can’t be captured by traditional RGB (visible) light or near-infrared bands, so the SWIR is extremely useful to differentiate corn and soybean,” Guan concludes.
The researchers used a type of machine-learning, known as a deep neural network, to analyze the data.
“Deep learning approaches have just started to be applied for agricultural applications, and we foresee a huge potential of such technologies for future innovations in this area,” says Jian Peng, assistant professor in the Department of Computer Science at U of I, and a co-author and co-principal investigator of the new study.
[This gif shows the Landsat Data Continuity Mission (LDCM) spacecraft successfully separating from the booster. Credits: NASA]
It turns out corn and soybean have predictably different leaf water status by July most years. The team used SWIR data and other spectral data from three Landsat satellites over a 15-year period, and consistently picked up this leaf water status signal.
“The SWIR band is more sensitive to water content inside the leaf. That signal can’t be captured by traditional RGB (visible) light or near-infrared bands, so the SWIR is extremely useful to differentiate corn and soybean,” Guan concludes.
The researchers used a type of machine-learning, known as a deep neural network, to analyze the data.
“Deep learning approaches have just started to be applied for agricultural applications, and we foresee a huge potential of such technologies for future innovations in this area,” says Jian Peng, assistant professor in the Department of Computer Science at U of I, and a co-author and co-principal investigator of the new study.
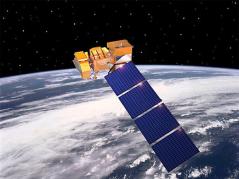 [Landsat 7]
The team focused their analysis within Champaign County, Illinois, as a proof-of-concept. Even though it was a relatively small area, analyzing 15 years of satellite data at a 30-meter resolution still required a supercomputer to process tens of terabytes of data.
“It’s a huge amount of satellite data. We used the Blue Waters and ROGER supercomputers at the NCSA to handle the process and extract useful information,” Guan says. “Technology wise, being able to handle such a huge amount of data and apply an advanced machine-learning algorithm was a big challenge before, but now we have supercomputers and the skills to handle the dataset.”
The team is now working on expanding the study area to the entire Corn Belt, and investigating further applications of the data, including yield and other quality estimates.
https://www.youtube.com/watch?v=bmoYMzGBN5s
Edited for WeatherNation by Meteorologist Mace Michaels
[Landsat 7]
The team focused their analysis within Champaign County, Illinois, as a proof-of-concept. Even though it was a relatively small area, analyzing 15 years of satellite data at a 30-meter resolution still required a supercomputer to process tens of terabytes of data.
“It’s a huge amount of satellite data. We used the Blue Waters and ROGER supercomputers at the NCSA to handle the process and extract useful information,” Guan says. “Technology wise, being able to handle such a huge amount of data and apply an advanced machine-learning algorithm was a big challenge before, but now we have supercomputers and the skills to handle the dataset.”
The team is now working on expanding the study area to the entire Corn Belt, and investigating further applications of the data, including yield and other quality estimates.
https://www.youtube.com/watch?v=bmoYMzGBN5s
Edited for WeatherNation by Meteorologist Mace Michaels
[University of Illinois scientists used short-wave infrared bands from Landsat satellites to accurately distinguish corn and soybeans during the growing season. Credit: Kaiyu Guan, University of Illinois]
The researchers argue more timely estimates of crop areas could be used for a variety of monitoring and decision-making applications, including crop insurance, land rental, supply-chain logistics, commodity markets, and more.
For Guan, however, the work’s scientific value is as important as its practical value.
A set of satellites known as Landsat have been continuously circling the Earth for 40 years, collecting images using sensors that represent different parts of the electromagnetic spectrum. Guan says most previous attempts to differentiate corn and soybean from these images were based on the visible and near-infrared part of the spectrum, but he and his team decided to try something different.
“We found a spectral band, the short-wave infrared (SWIR), that was extremely useful in identifying the difference between corn and soybean,” says Yaping Cai, Ph.D. student and first author of the work, following the guidance of Guan and another senior co-author, Shaowen Wang in the Department of Geography at U of I.
[This gif shows the Landsat Data Continuity Mission (LDCM) spacecraft successfully separating from the booster. Credits: NASA]
It turns out corn and soybean have predictably different leaf water status by July most years. The team used SWIR data and other spectral data from three Landsat satellites over a 15-year period, and consistently picked up this leaf water status signal.
“The SWIR band is more sensitive to water content inside the leaf. That signal can’t be captured by traditional RGB (visible) light or near-infrared bands, so the SWIR is extremely useful to differentiate corn and soybean,” Guan concludes.
The researchers used a type of machine-learning, known as a deep neural network, to analyze the data.
“Deep learning approaches have just started to be applied for agricultural applications, and we foresee a huge potential of such technologies for future innovations in this area,” says Jian Peng, assistant professor in the Department of Computer Science at U of I, and a co-author and co-principal investigator of the new study.
[Landsat 7]
The team focused their analysis within Champaign County, Illinois, as a proof-of-concept. Even though it was a relatively small area, analyzing 15 years of satellite data at a 30-meter resolution still required a supercomputer to process tens of terabytes of data.
“It’s a huge amount of satellite data. We used the Blue Waters and ROGER supercomputers at the NCSA to handle the process and extract useful information,” Guan says. “Technology wise, being able to handle such a huge amount of data and apply an advanced machine-learning algorithm was a big challenge before, but now we have supercomputers and the skills to handle the dataset.”
The team is now working on expanding the study area to the entire Corn Belt, and investigating further applications of the data, including yield and other quality estimates.
https://www.youtube.com/watch?v=bmoYMzGBN5s
Edited for WeatherNation by Meteorologist Mace MichaelsAll Weather News
More
Warmer Than Average: Above-Normal Temperatures Across the Central U.S. This Week
WHAT TO EXPECTA ridge of high pressure will b
21 Oct 2026 12:50 AM


Severe Weather & Heavy Rainfall Aims for the West This Week
Looking ahead to this week, a low-pressure sy
21 Oct 2026 12:40 AM

Nor'Easter Riles up the Waves This Week
SETUPAn upper-level low broke off from the fl
21 Oct 2026 12:25 AM

Several Fires Break Out in SoCal Last Week Amid Santa Ana Wind Event
Santa Ana winds helped several fires grow qui
19 Oct 2026 1:25 PM

Another Cold Morning Before Things Warm Back Up
Across portions of the Ohio Valley through th
19 Oct 2026 10:15 AM

Severe Risk Diminishing Saturday Morning for the Northeast
Severe Storm PotentialSevere risk is decreasi
16 Oct 2026 10:20 AM