When to Expect Your Last Spring Freeze

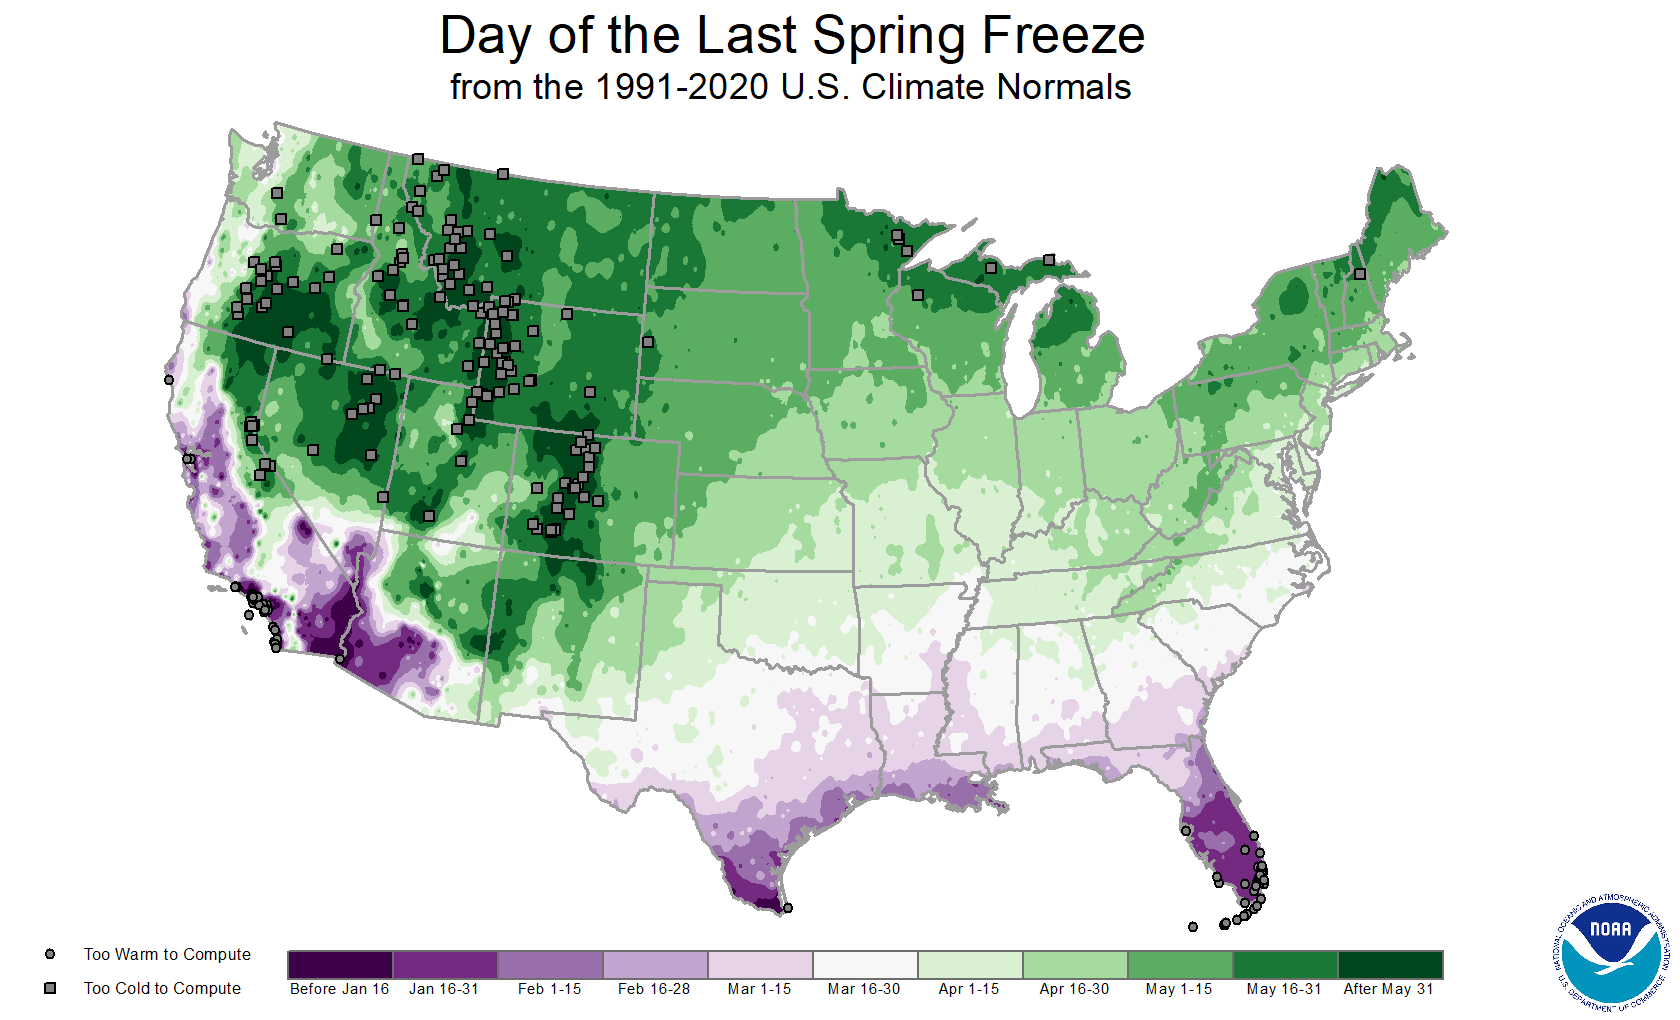
Wondering what happens in Alaska, Hawaii, and Puerto Rico? The unique climates of these regions pose a problem in calculating the average date of the last spring freeze. Nearly all of Alaska falls into the “too cold to compute” category, meaning that the state is likely to see freezing temperatures year-round. At the opposite end of the spectrum, all of Puerto Rico and all but the highest elevations of the state of Hawaii fall into the “too warm to compute” category, meaning that they very rarely or never see freezing temperatures.
While the 50% probability of 32°F version of the “Freeze Normals” was used to create the map, these Normals come in a variety of levels to aid in evaluating different critical temperatures. Freeze Normals are available at 10%, 20%, 30%, 40%, 60%, 70%, 80%, and 90% probability levels for 16°F, 20°F, 24°F, 28°F, 32°F, and 36°F. You can access the Freeze Normals by visiting the NOAA interactive map by using the Climate Data Online application and selecting the Annual Climate Normals layer. [Image from December]
Freeze Normals are especially useful to agriculture and gardening. For farmers, planting early can yield high rewards, but it also poses a significant risk to their plants. Freeze Normals can help them determine when they’re most likely to see their last spring freeze, allowing them to mitigate some of that risk. Additionally, these Normals can help determine when pests are likely to emerge in specific areas. And, plant nurseries use these Normals and the information they provide about planting and growing conditions to help determine where and when to advertise plants and seeds to customers in a specific area. While the map shows the average timeframe of the last spring freeze across the United States, this year’s actual conditions may vary widely based on weather patterns.
For additional information and an interactive map, see NOAA Climate. Edited for WeatherNation by Meteorologist Mace Michaels